What’s the best RSI setting for a 5-minute scalping?
For 5-minute scalping, the 7-period RSI is usually the best choice. It strikes a good balance between reacting quickly to big price moves while also ignoring small, unimportant changes. If you use a 5-period RSI, it might react even faster, but the problem is that it often gives too many false signals (i.e., it might say the market is overbought just because of a small upward move or oversold because of a tiny dip). This can make you take trades that aren’t really worth it.
Best strategy to use the 7-period RSI for 5-minute scalping
Here is a good way to use the 7-period RSI setting works on a 5-minute chart:
Step 1: Setup
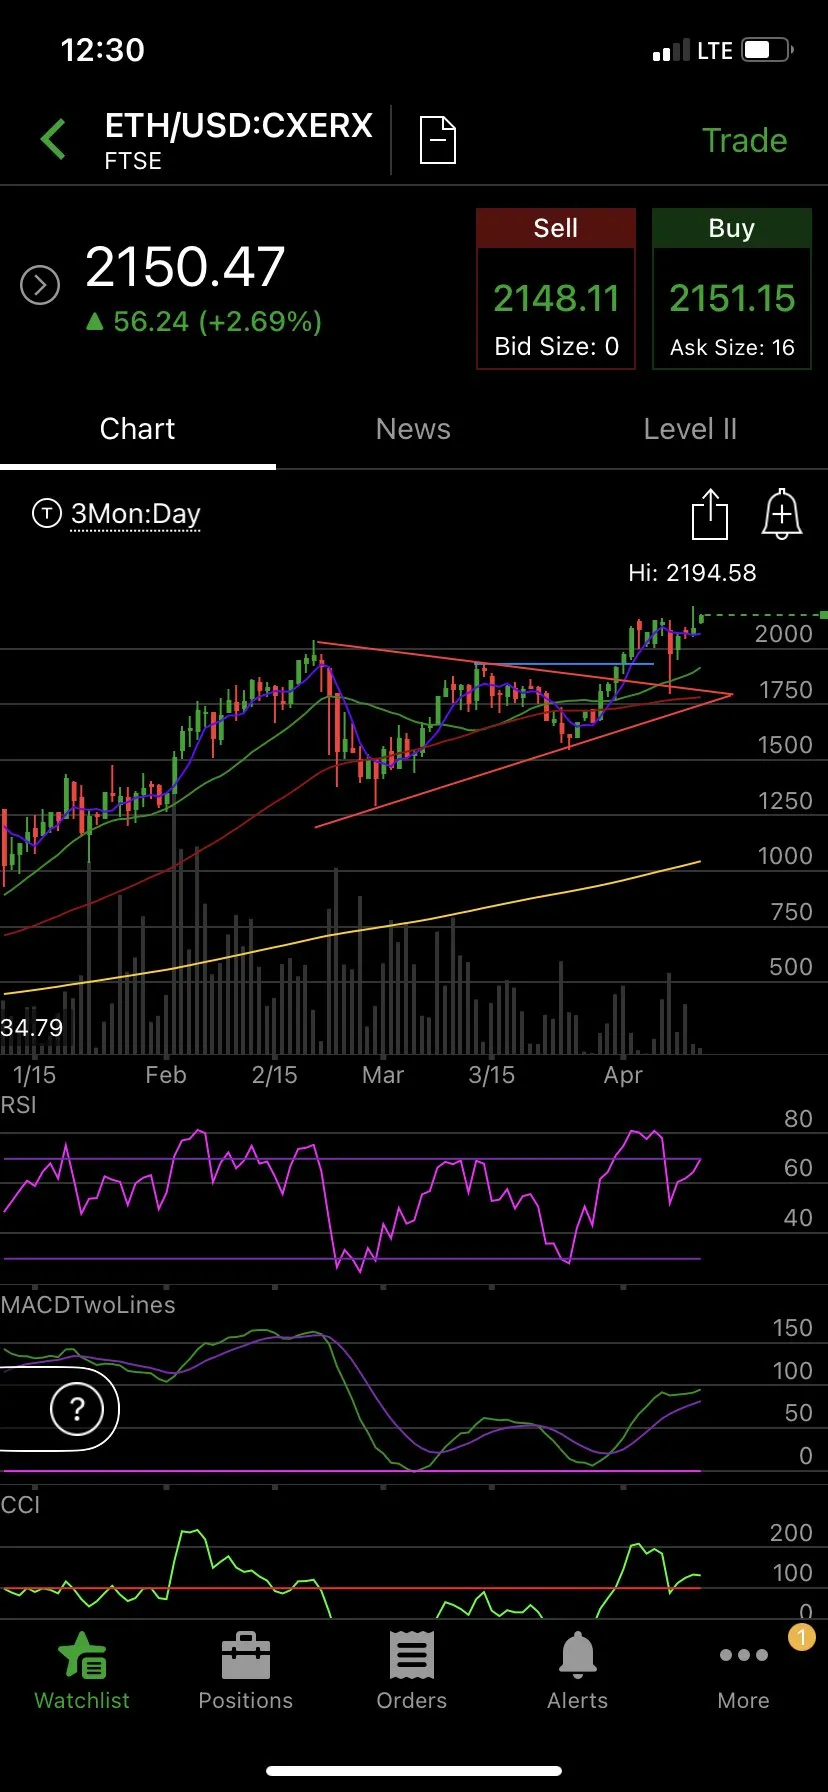
Start by setting your trading chart to a 5-minute time frame. This helps you catch quick price changes. Add the Relative Strength Index (RSI) with a setting of 7 to track short-term momentum. To see the trend direction, use two moving averages: the 20 EMA to spot quick trend changes and the 50 EMA to confirm the overall trend.
%252C%2520together%2520with%2520EMAs.webp)
Step 2: How to spot a buy signal
Look for the RSI (7) to drop below 30, which means the market is oversold. When the RSI starts moving up from this level, it signals that buyers might be coming back. To make sure the trend is positive, check that the price is above both the 20 EMA and 50 EMA. This shows that the overall direction is up.
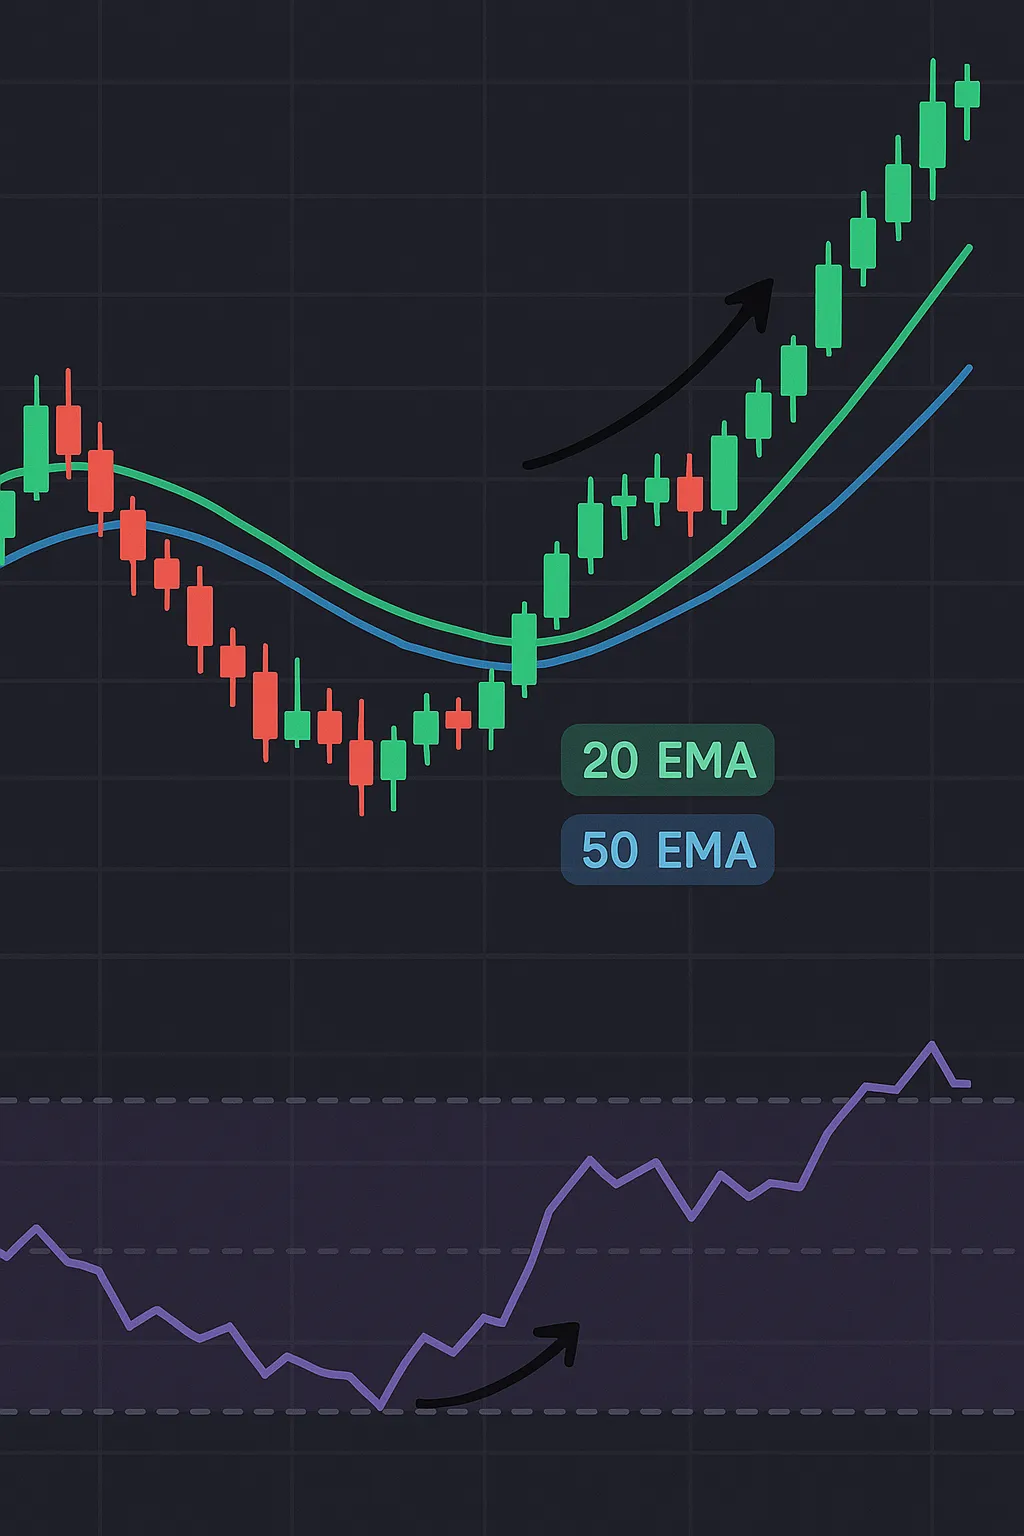
Don't rush in right away. Wait for the next green candle to close. This means buyers are strong enough to keep pushing the price higher.
Step 3: How to spot a sell signal
A sell signal appears when the RSI (7) goes above 70, meaning the market is overbought. Once the RSI starts falling from this level, it hints that sellers are taking control. Check if the price is below both the 20 EMA and 50 EMA to confirm that the trend is down.
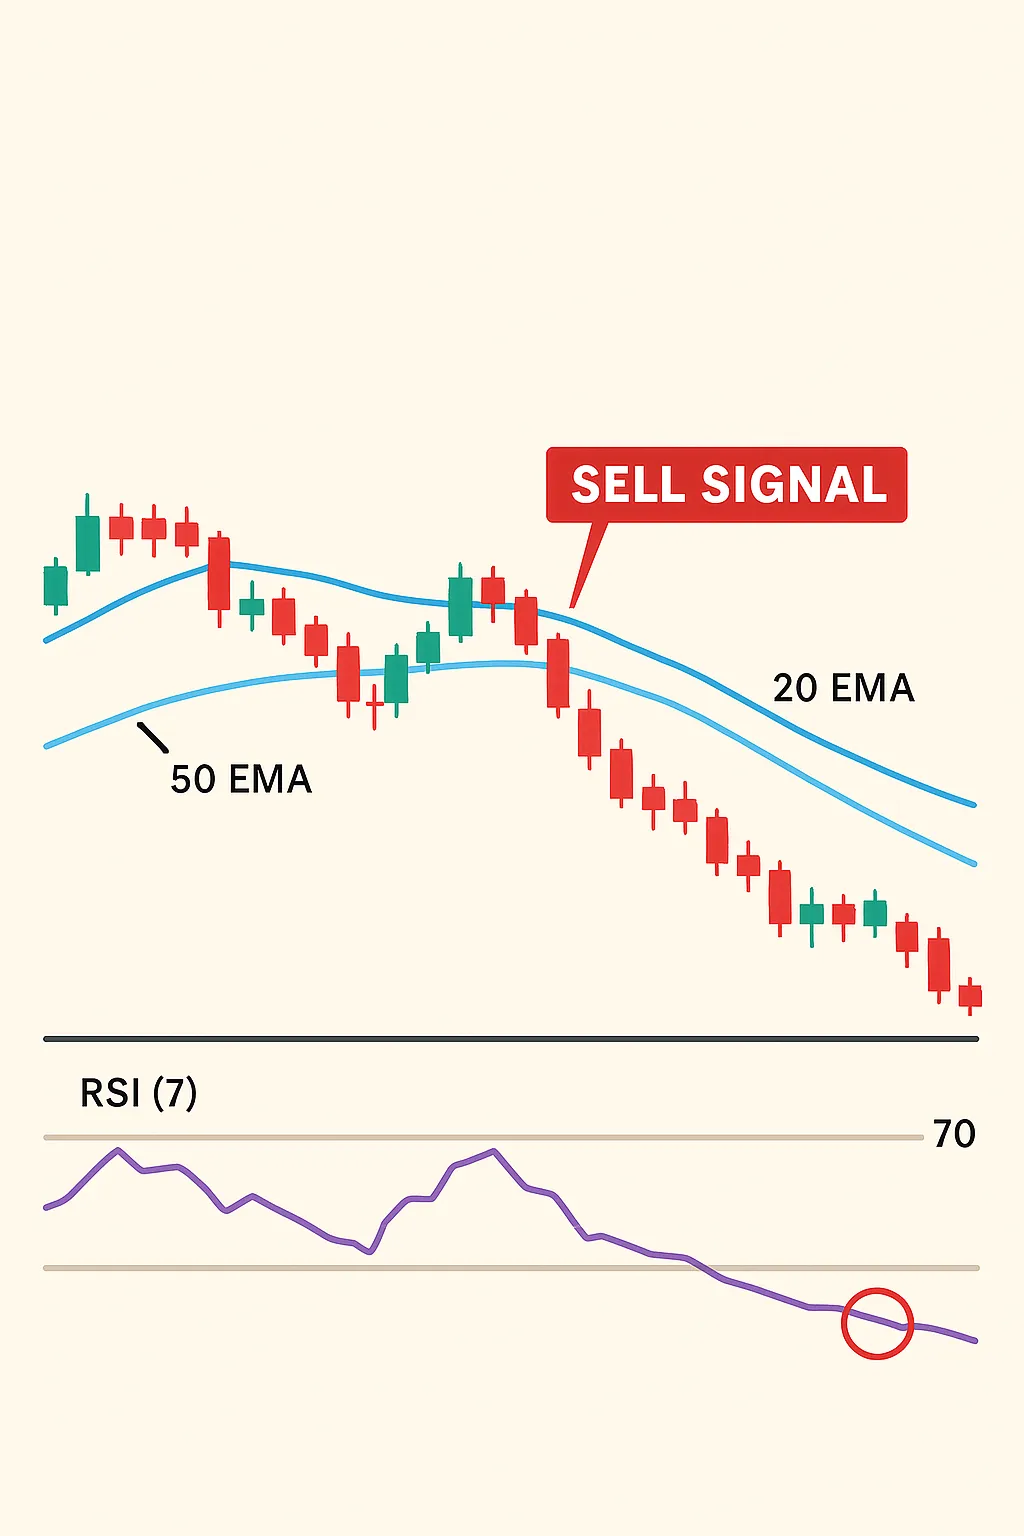
Again, don't jump in too quickly. Wait for the next red candle to close. This confirms that sellers are strong enough to keep pushing the price lower.
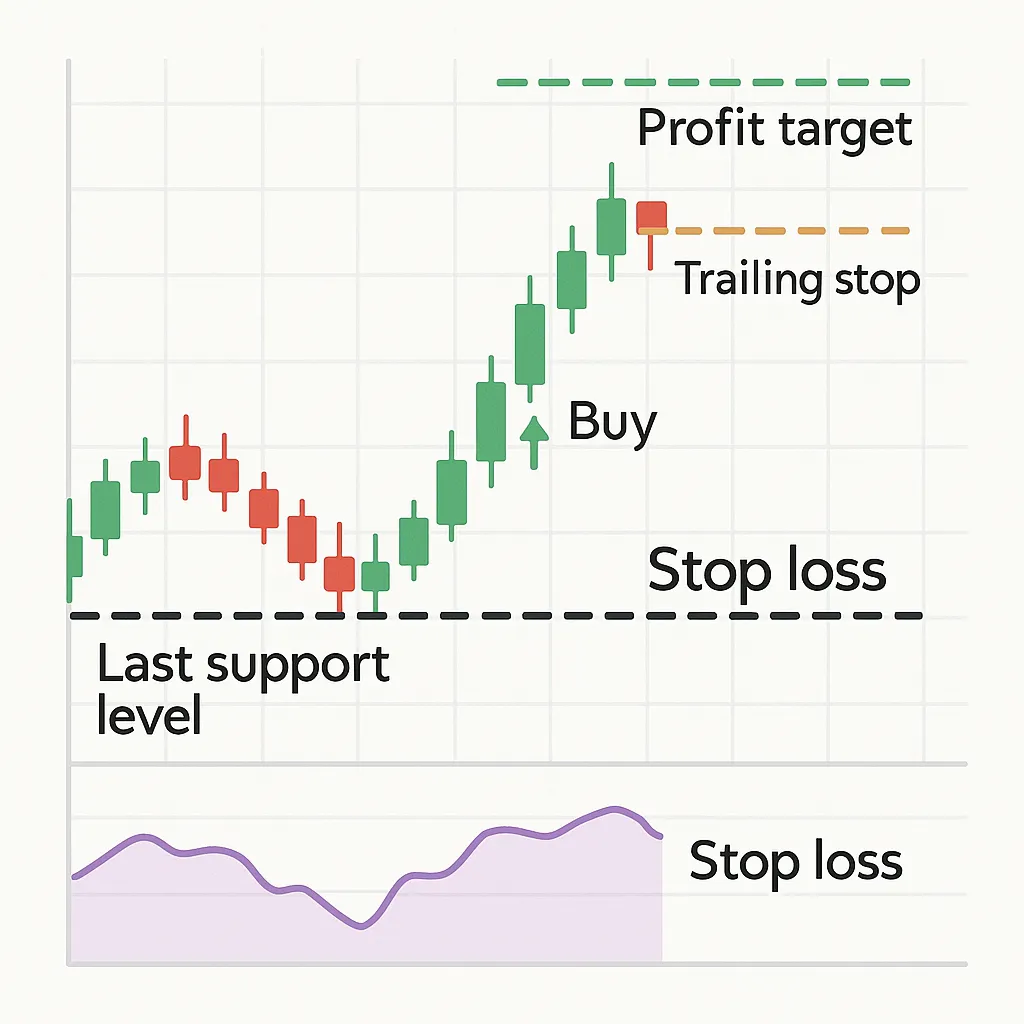
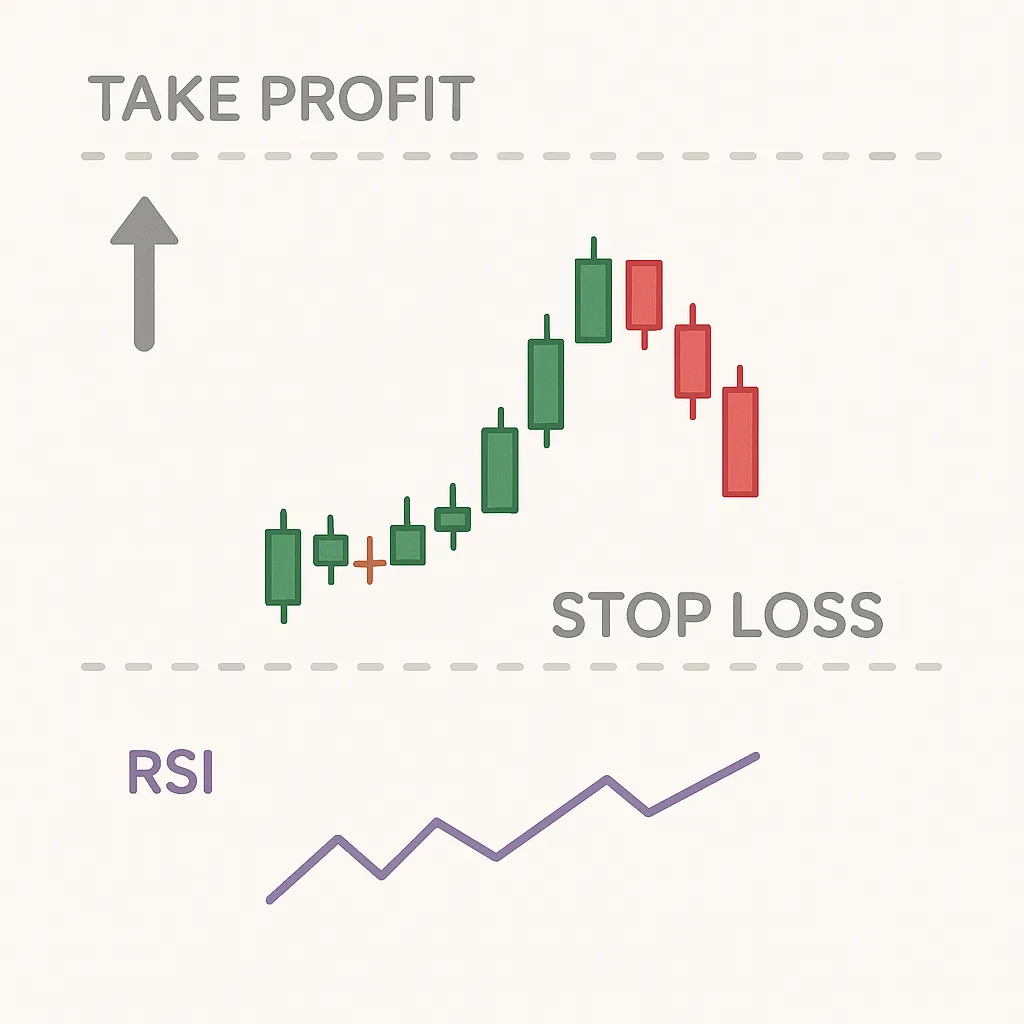
Step 4: Exiting the trade
The goal is to make a profit while keeping your losses small. Set a profit target of 5-10 pips (small price movements) or exit if the RSI (7) goes back to 50, which means the momentum is fading.
To protect your money, place a stop loss just below the last support level if you're buying or just above the last resistance if you're selling. As the trade goes in your favor, move your stop loss to lock in your gains (called a trailing stop).
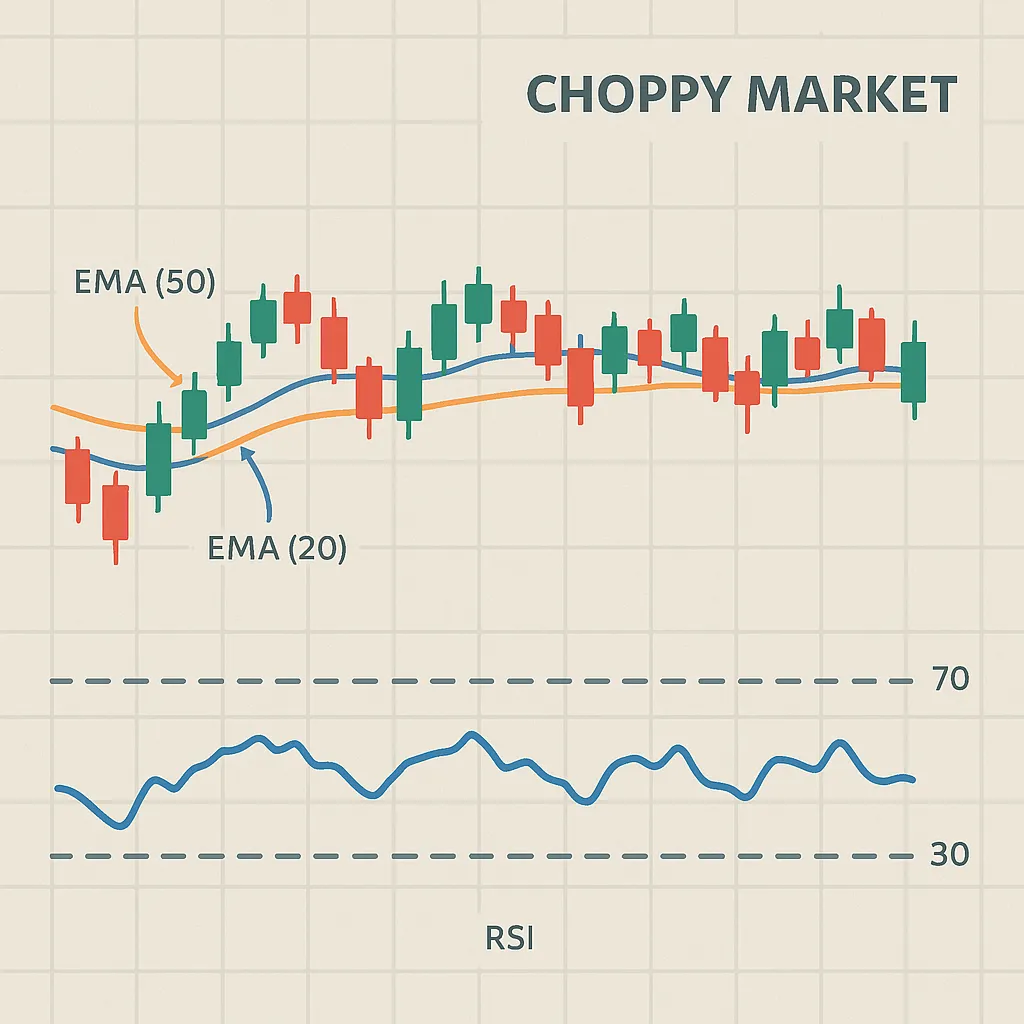
Step 5: Dealing with choppy markets
Sometimes the market moves sideways and doesn’t have a clear trend. You’ll see both EMAs get close together, and the RSI (7) will bounce between 30 and 70 without much direction. This is called a choppy market. It’s best to stay out of trades during this time because it’s too unpredictable.
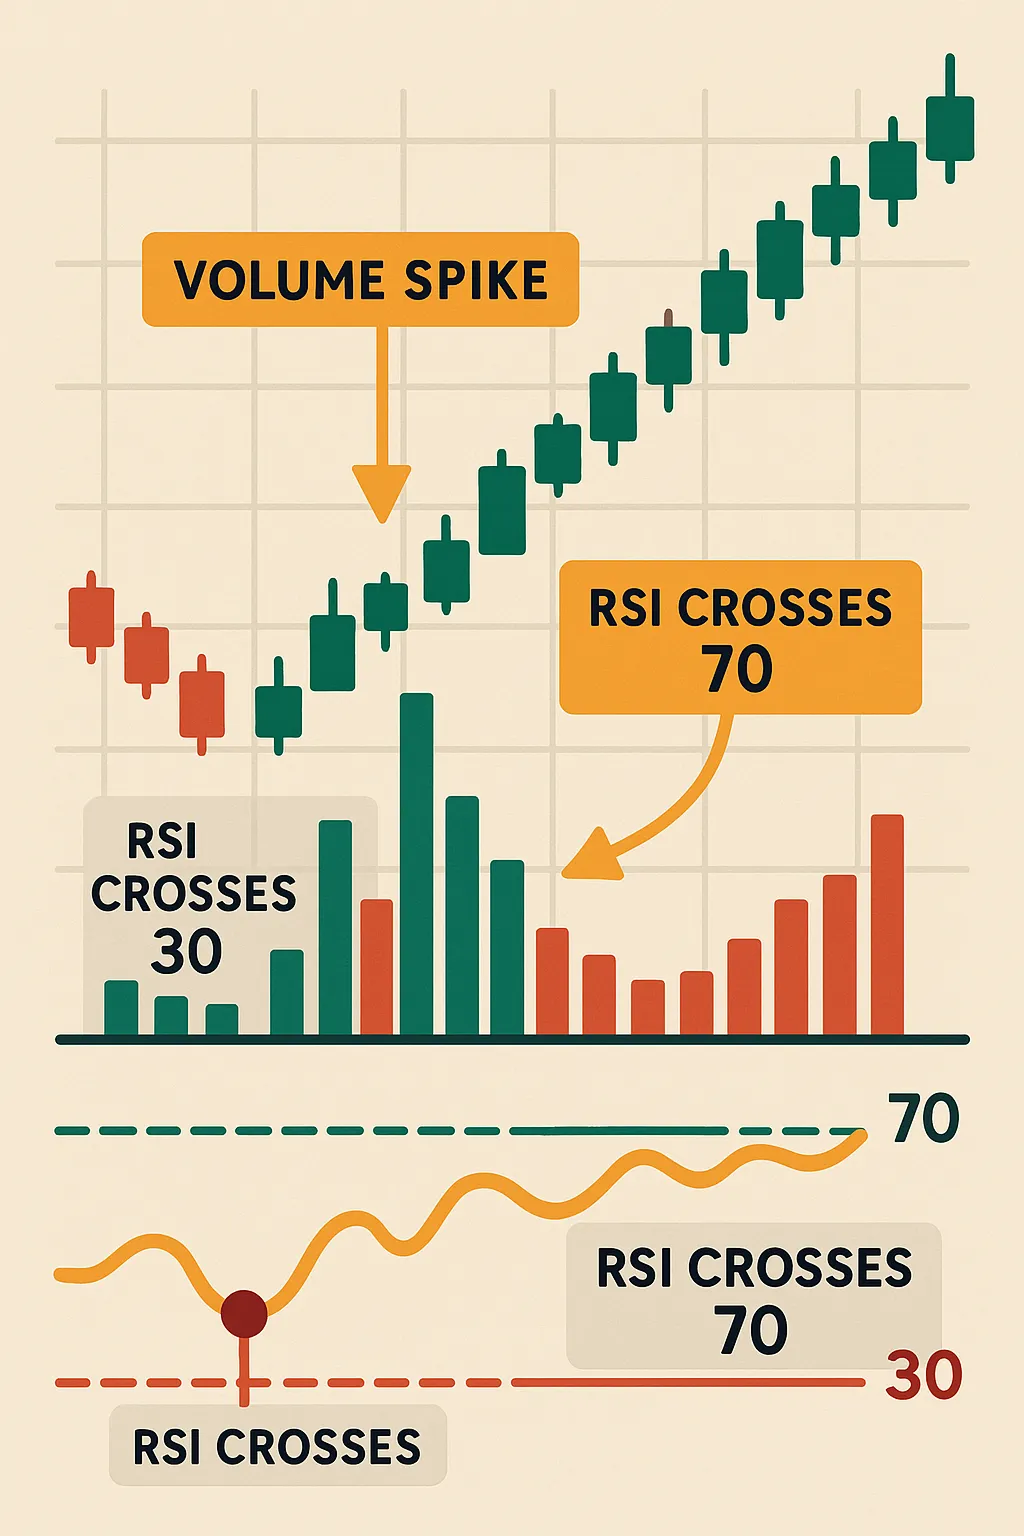
Step 6: Confirm with volume
Volume shows how much activity there is in the market. If there’s a spike in volume when the RSI (7) crosses 30 or 70, it means more people are trading, which usually means a stronger move. This helps reduce the risk of falling for a fake breakout.
Step 7: Manage your risk
Don’t risk too much money on one trade. Keep your risk to 1-2% of your total trading capital. This way, even if the trade goes wrong, you won’t lose too much, and you’ll have enough left to keep trading.
💡 Check out the 32+ factors we check to ensure a token/crypto’s legitimacy.
What is the best RSI setting for 1-minute scalping?
When trading on a 1-minute chart, the best RSI setting is typically RSI 2 or 3. These settings are highly responsive because they use a very short calculation period (i.e., 2 or 3 periods or candles), allowing the indicator to react almost immediately to even small price changes. This rapid responsiveness helps you spot potential entry and exit points more quickly, which is crucial for scalping strategies where speed is essential.
However, the downside is that these settings can generate more false signals because they are too sensitive to minor fluctuations or market noise. Thus, traders often combine RSI 2 or 3 with another indicator (i.e., EMA 20 or EMA 50), to filter out false signals and improve the overall accuracy of their trades.
Best strategy to use the 2 or 3-Period RSI for 1-minute scalping
A good way to use the 2 or 3-period RSI setting for 1-minute scalping is:
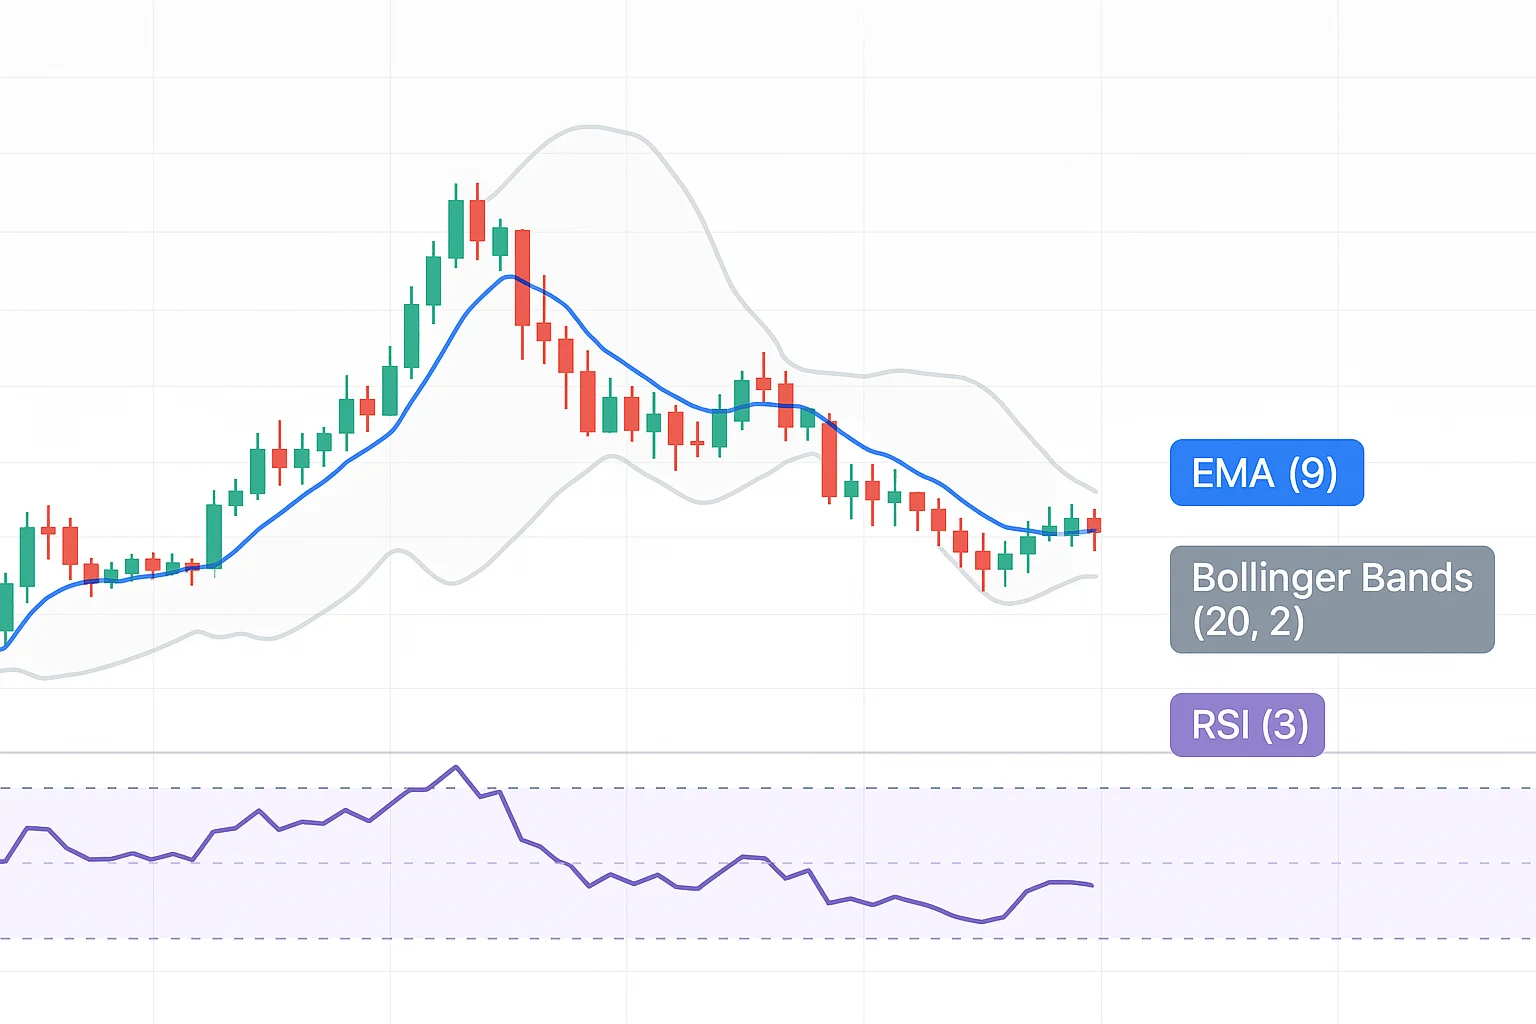
Step 1: Setting up your chart
Start by configuring your chart to the 1-minute time frame, as such scalping requires quick, precise decisions. Add three key indicators to enhance accuracy: the RSI (2 or 3) to detect rapid price movements, the Exponential Moving Average (EMA 9) to confirm short-term trends, and Bollinger Bands (20, 2) to identify volatility and potential reversal zones.
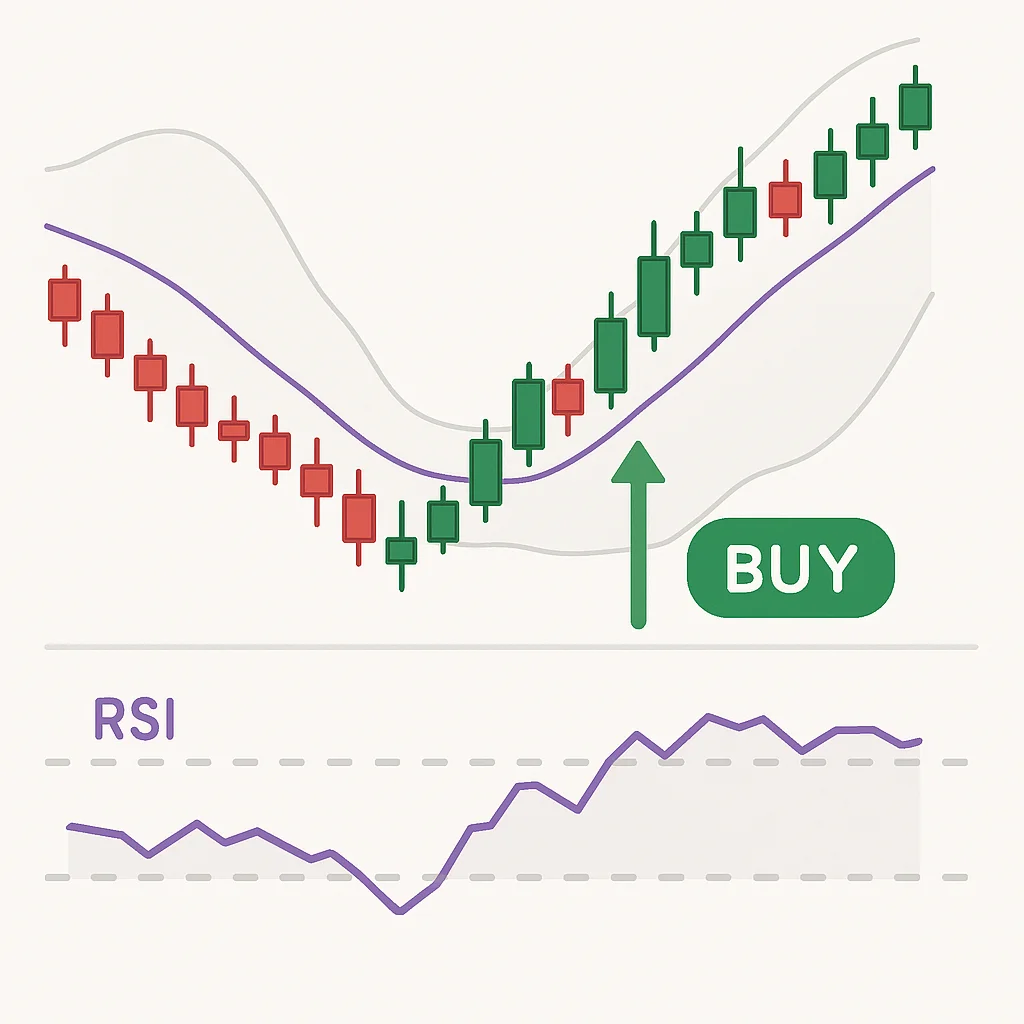
Step 2: Defining your entry rules
For a buy signal, wait for the RSI (2 or 3) to drop below 20, indicating an oversold condition, and then cross back above 20. At the same time, ensure the price touches or moves slightly outside the lower Bollinger Band while remaining above the 9 EMA, indicating an uptrend. Enter the trade as soon as the next candle closes bullish.
For a sell signal, look for the RSI (2 or 3) to rise above 80 and then cross back below 80, while the price touches or moves slightly outside the upper Bollinger Band and stays below the 9 EMA, indicating a downtrend. Enter the trade when the next candle closes bearish.
Step 3: Establishing exit rules
To secure profits, set a take profit target of around 3-5 pips, depending on market volatility. Consider exiting the trade if the RSI (2 or 3) crosses back to the 50 level, as this signals a loss of momentum. To minimize risk, place a stop loss just beyond the most recent swing high (for short trades) or swing low (for long trades). Additionally, use a trailing stop to lock in gains as the trade moves in your favor.
Step 4: Filtering and optimizing
To avoid false signals, skip trades when the RSI (2 or 3) oscillates frequently between 20 and 80 without a clear price direction, as this may indicate market indecision. Volume can also be a helpful confirmation tool (i.e., look for higher volume during RSI crossings, as this indicates stronger momentum and a higher chance of success).
Be cautious during flat markets, however, where Bollinger Bands are narrow, as this signals low volatility, making RSI signals less reliable. Wait for the bands to widen, showing increased volatility, before entering a trade.
Best indicators to combine with RSI for scalping
Here are the most effective indicators to pair with RSI for scalping:
1. Moving average (MA)
When combined with RSI (14), a short-term MA (like the 9-period or 21-period) acts as a trend filter as it helps identify the overall trend direction by smoothing out the price data, confirming whether the rapid RSI signals are aligned with the current market trend.
For example, if the RSI (14) signals a buy but the price is below the MA (21-period EMA, indicating a short-term downtrend), it may indicate a weak or false signal. On the other hand, if both the RSI and MA indicate a buy in an uptrend (price is above the 21-period EMA and the RSI is moving upward from the oversold zone), it strengthens the trading decision, minimizing the chances of trading against the prevailing trend.
2. Bollinger bands
When combined with RSI (7) for scalping, the most effective Bollinger Bands setting is (20, 2), where 20 represents the period for the moving average (usually a simple moving average), and 2 represents the number of standard deviations that set the distance of the bands from the moving average.
For instance, when the RSI (7) indicates an overbought condition (above 70) and the price touches or exceeds the upper Bollinger Band (indicating that the price is stretched far from the average, suggesting a potential reversal), it signals a potential short opportunity (especially if the candle also shows a sign of rejection, like a long wick).
Similarly, when the RSI (7) indicates an oversold condition (below 30) and the price touches or drops below the lower Bollinger Band (indicating that the price may be undervalued and could revert to the mean), it suggests a potential long trade (preferably after a confirmation candle closes above the lower band, showing buying pressure).
3. MACD (Moving Average Convergence Divergence)
The MACD detects momentum changes by comparing short and long-term moving averages, typically the 12 and 26-period EMAs. Pairing it with RSI (14) helps verify the strength of a trend or a potential reversal.
For instance, if the RSI (14) shows an overbought condition but the MACD histogram and signal line are still bullish (the histogram bars are above the zero line, and the signal line is above the MACD line), it may indicate that the trend has more room to run. Conversely, when both RSI (14) and MACD indicate a reversal (the MACD line crosses below the signal line, or the histogram shifts from positive to negative), it signals a more reliable entry or exit point.
4. CCI (Commodity Channel Index):
When using CCI (Commodity Channel Index) with RSI (9) for scalping, the optimal CCI setting is typically 14, meaning it calculates the average price deviation over the last 14 periods or candles. In scalping, traders look for the CCI to cross above +100 to signal potential overbought conditions or drop below -100 to indicate potential oversold conditions.
For instance, when both RSI (9) and CCI align — such as the RSI (9) being above 70 while the CCI is above +100 (indicating an overbought condition) or the RSI being below 30 while the CCI is below -100 (indicating an oversold condition) — it provides a more reliable signal of a potential reversal.
💡 Check out the best crypto indicators in 2025 and how to use them
When whale alerts align
Whale alerts are crucial signals for scalpers looking to capitalize on short-term price movements. When these alerts align across multiple indicators (like RSI, Bollinger Bands, and Moving Averages), it signals a high-probability trade setup.
What to do:
1. Confirm the signal: Make sure the alert aligns with market conditions (e.g., trend direction confirmed by a Moving Average or MACD).
2. Entry strategy: Enter the trade immediately after confirmation. Use smaller time frames (1-minute or 5-minute charts) to fine-tune your entry point.
3. Risk management: Set a tight stop-loss since scalping requires quick reactions to market changes.
4. Take profits quickly: Once the price moves in your favor, secure your gains. Don’t hold for long since scalping aims to capture small, rapid movements.
5. Monitor multiple pairs: If whale alerts align on multiple pairs or assets, prioritize those with the most significant volume and volatility.
💡 Pro Tip: Combining whale alerts with other indicators like RSI and Bollinger Bands during high-volatility trading sessions (like the London-New York overlap or peak crypto trading hours) can significantly increase the accuracy of your scalping strategy.
Best trading sessions for scalping
Scalping works best when the market is active and moving. This means you want to trade when there’s a lot of buying and selling going on, which creates big price swings.
In traditional markets (like forex or stocks), the best times for scalping are during the London and New York sessions. These are the most popular trading sessions because they overlap for a few hours, leading to lots of trading activity and big price moves.
In the crypto market, it’s a bit different because trading never stops — it’s open 24/7. However, volatility still changes throughout the day. The most active times usually happen when major global financial hubs (like the US, Europe, or Asia) are most active. This means you might see more movement during US trading hours or when there’s big news affecting the crypto world.
Simply put, scalping works best when the market is busy because that’s when prices move fast enough to make quick profits.
Practical tips and risk management
When scalping, it’s crucial to balance the pursuit of quick profits with sound risk management practices, like:
1. Setting realistic profit targets
Set realistic goals per trade (like 0.5% to 1%). Avoid being greedy. Stick to your strategy, and don’t chase big gains during scalping.
2. Managing leverage responsibly
Use leverage cautiously, typically between 1:5 and 1:20. Always calculate the risk before entering a trade, especially in highly volatile markets.
3. Keeping a trading journal
Document every trade, including the setup, indicators used, entry/exit points, and the outcome. Analyzing your trading journal regularly helps you spot patterns, improve strategies, and reduce mistakes.
Final thoughts
By combining RSI with complementary indicators like EMA, Bollinger Bands, and MACD (and even whale alerts), you can enhance your chances to scalp like a pro.
And pros love MC² Finance as it helps analyze market data and optimize trading strategies efficiently.
Start trading smarter today like Mattias!
�
�
For an extra read on sentiment while scalping, some traders cross-reference live crypto prediction markets, where crowd positioning can hint at near-term direction before it shows on the tape.